Easy to use,
full-stack monitoring

A flexible monitoring tool that doesn’t break the bank. Use TelemetryHub for your logs, traces or metrics…
or all three!

Trace what matters.

Whether you’re running microservices, serverless, monoliths, or some combination of those, our distributed tracing will help you understand how your application is running from end-to-end and help you pinpoint, prioritize, and fix issues fast. We’ve got simple setup configurations for numerous popular languages like JavaScript, Python, Go, Java, .NET, PHP, Rust, Ruby, and more. And you can enable auto-instrumentation for your application dependencies from any of the hundreds of popular libraries available in your languages of choice with just a single line of code.

Full visibility into your systems.

Edge cases, partial interruptions, and nuanced bugs are the scourge of modern front-end and back-end applications. The devil’s in the details. With TelemetryHub, you can quickly explore and filter based on detailed context included in every bit of telemetry data you send. And even more exciting, you can easily attach your own custom application and business information for precise insights into your most important code paths without restriction. There’s no high-cardinality ceiling in TelemetryHub. Attach user or account IDs, product SKUs, or whatever else matters that will help you understand your systems better and we’ll help you make sense of that data.

Logs, logs, logs.

Application monitoring without integrated logging is so 2005. Not only can you gather all your logs into a single log aggregator, they automatically connect to any other telemetry data you send. When a high-priority issue threatens to derail your day, connecting those dots can be the difference between a good day and a headache. Oh, and forget the loading and paging logs browser of the past. With TelemetryHub, you can load and regex-explore tens of millions of logs at once and find that needle in the haystack much quicker.

Meaningful Metrics

Metrics are rapidly becoming just as important to monitoring the application layer as they already are for infrastructure monitoring, especially when it comes to understanding application performance changes over frequent releases. Enable numerous standard metrics as part of the auto-instrumentation process, and go beyond with easily-configurable custom metrics, to track trends in your applications over time and solve them before they become problems. Add extra attributes to your metrics to easily drill down on different segments and application behaviors for even greater clarity.
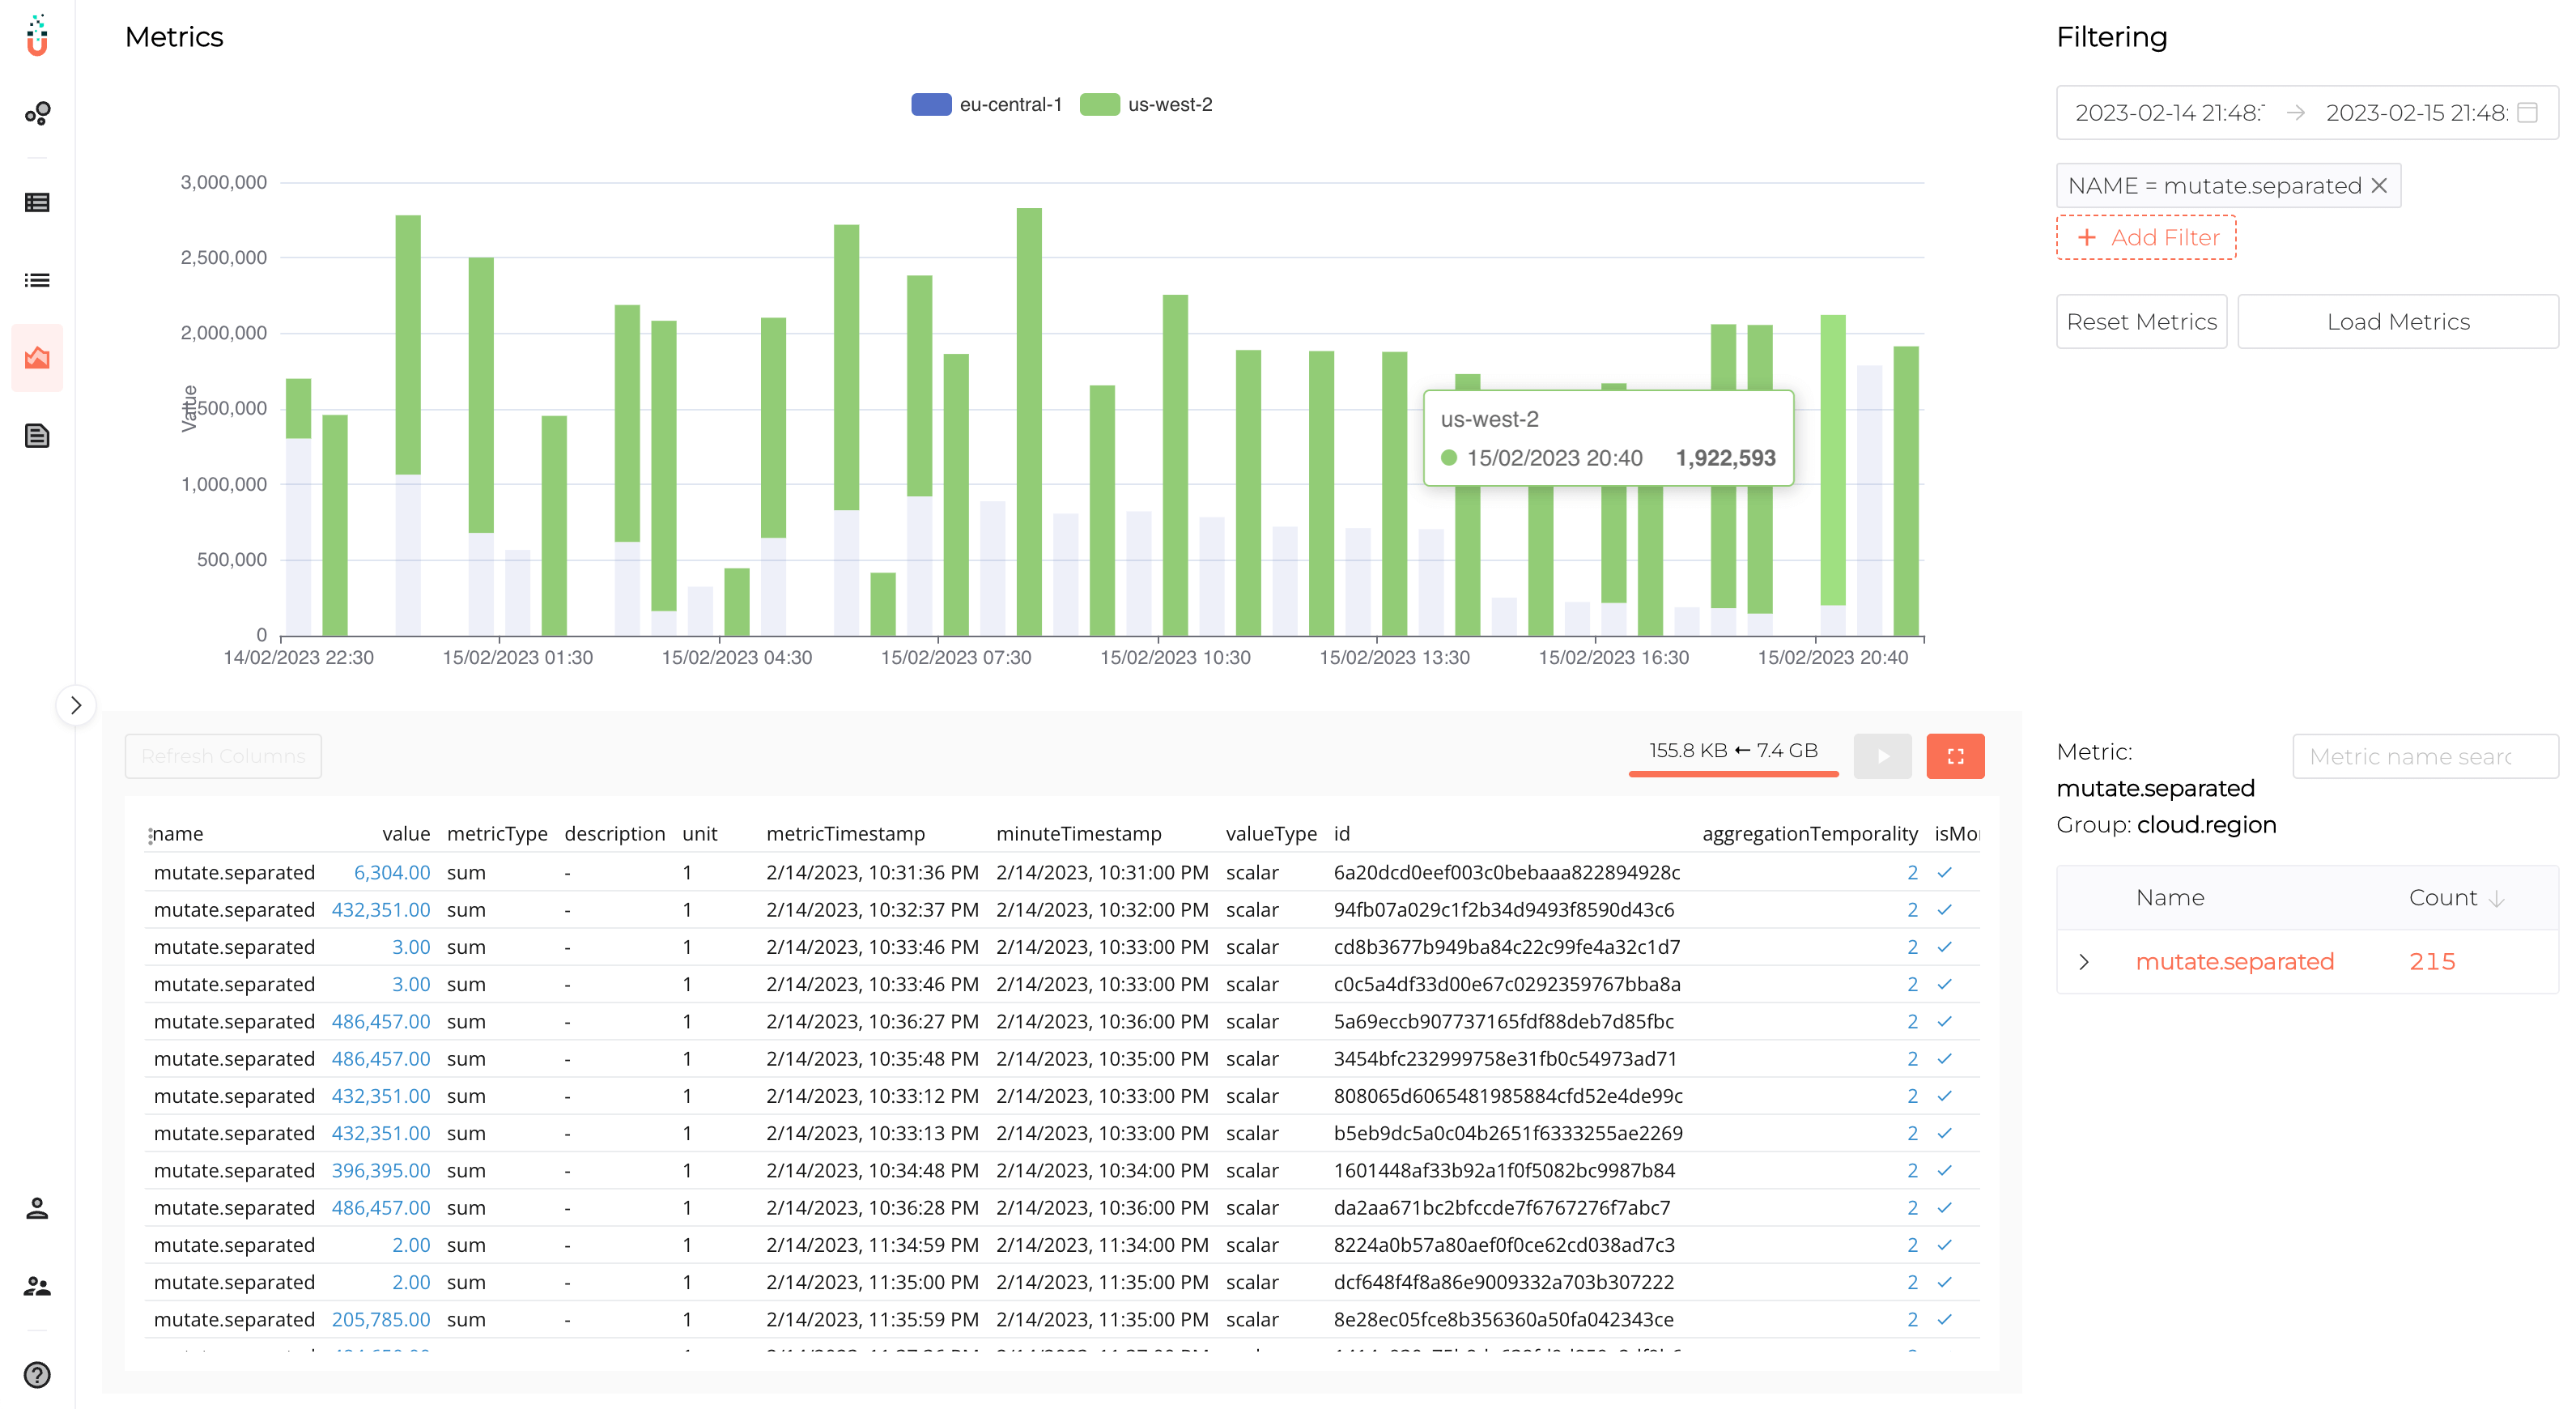
Connected to environments.

The once great divide between application monitoring and infrastructure monitoring is thankfully on the extinction path. TelemetryHub gives you useful insights into how your applications are interacting with their hosted environments.
Want to know every pod, node, and cluster involved in serving a given request? So did we, and so we built a tool for it.
Interested to know if a performance issue is caused by underperforming networking on a particular host? Yep, that too.
Not all businesses need a DevOps team and the slew of DevOps tools that come with it. TelemetryHub makes it easy to save on the DevOps toolbelt and replace it with a single, reliable logging and monitoring tool.

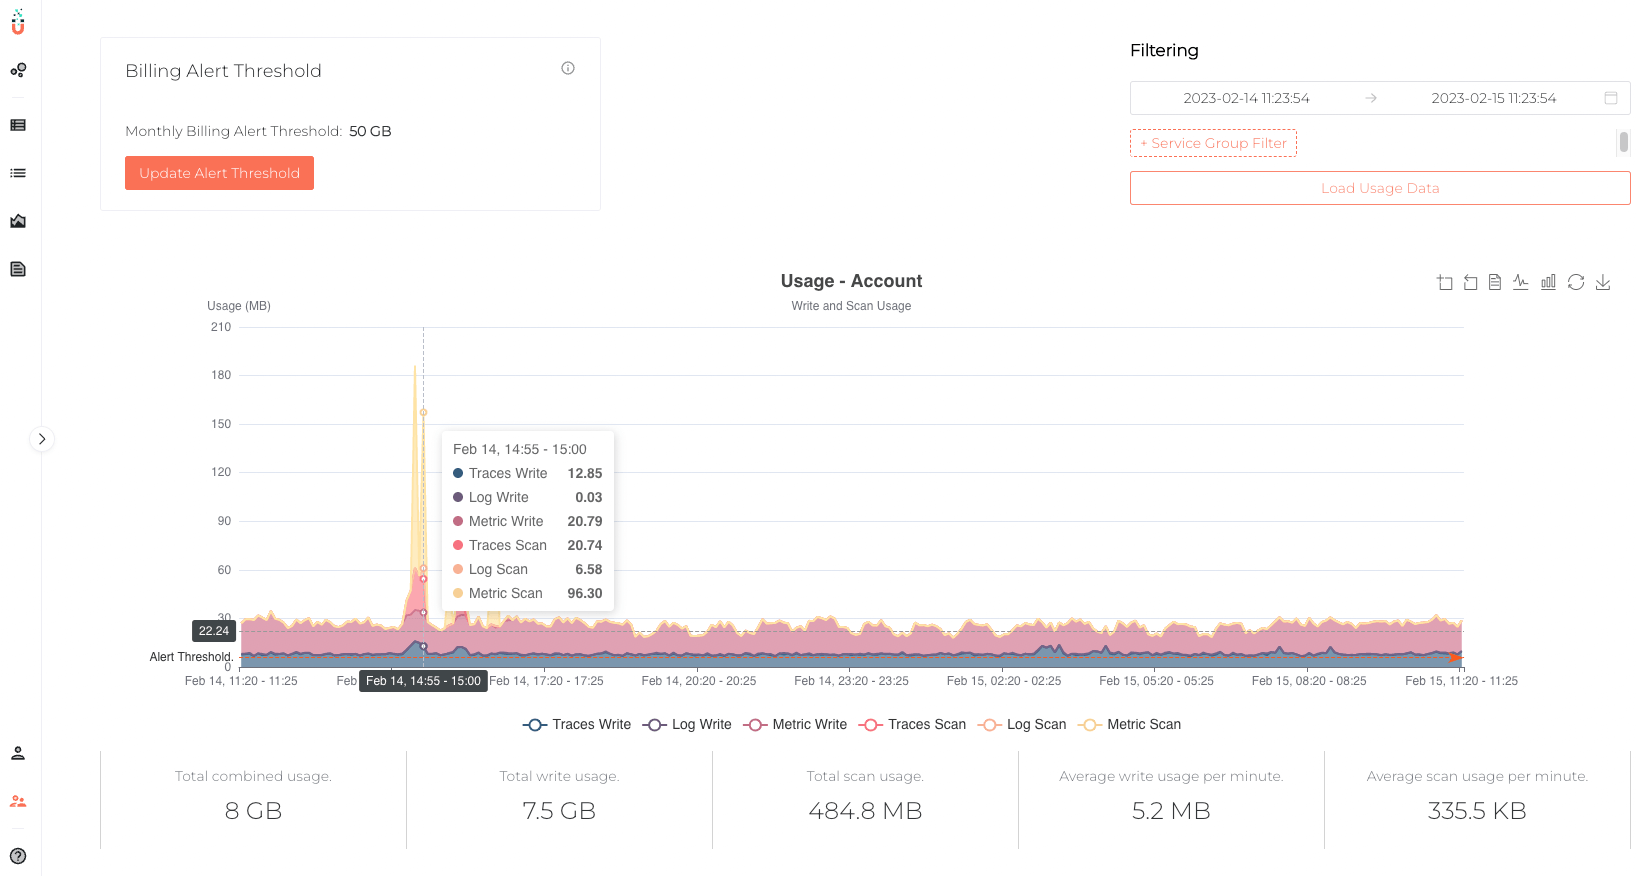
Control your costs.

We won’t name names, but other monitoring solutions like to hide their high costs behind opaque pricing and cost-creeping features. Not TelemetryHub. We treat affordability as a first-class feature, with transparent pricing and cost management functionality that is simple and helps keep you on budget.
Want a more traditional APM?

We’ve been at this “monitoring” stuff for a while. Our traditional Application Performance Monitoring (APM) for Ruby on Rails has been helping thousands of developers solve issues for almost a decade. We’ve got you covered if you are looking for a more traditional Rails performance monitoring.

What is TelemetryHub and how does it work?

TelemetryHub is an observability tool that collects all your complex telemetry data into a single pane of glass view by leveraging the power of OpenTelemetry.

What makes TelemetryHub different?

Simplicity

An easy-to-use metrics interface means a faster and more direct path to resolution by leveraging telemetry data to answer unknowns.

Affordability

No per-seat licensing means you can share the tool and observability data with everyone who needs it.

Efficiency

Easily explore and analyze issues through an out-of-the-box dashboard view of structured logs, metrics and tracing data.

All in on OpenTelemetry

Open Source is the future of the observability space, and we are diving in head first to deliver a full-stack observability tool built from scratch.

TelemetryHub Features

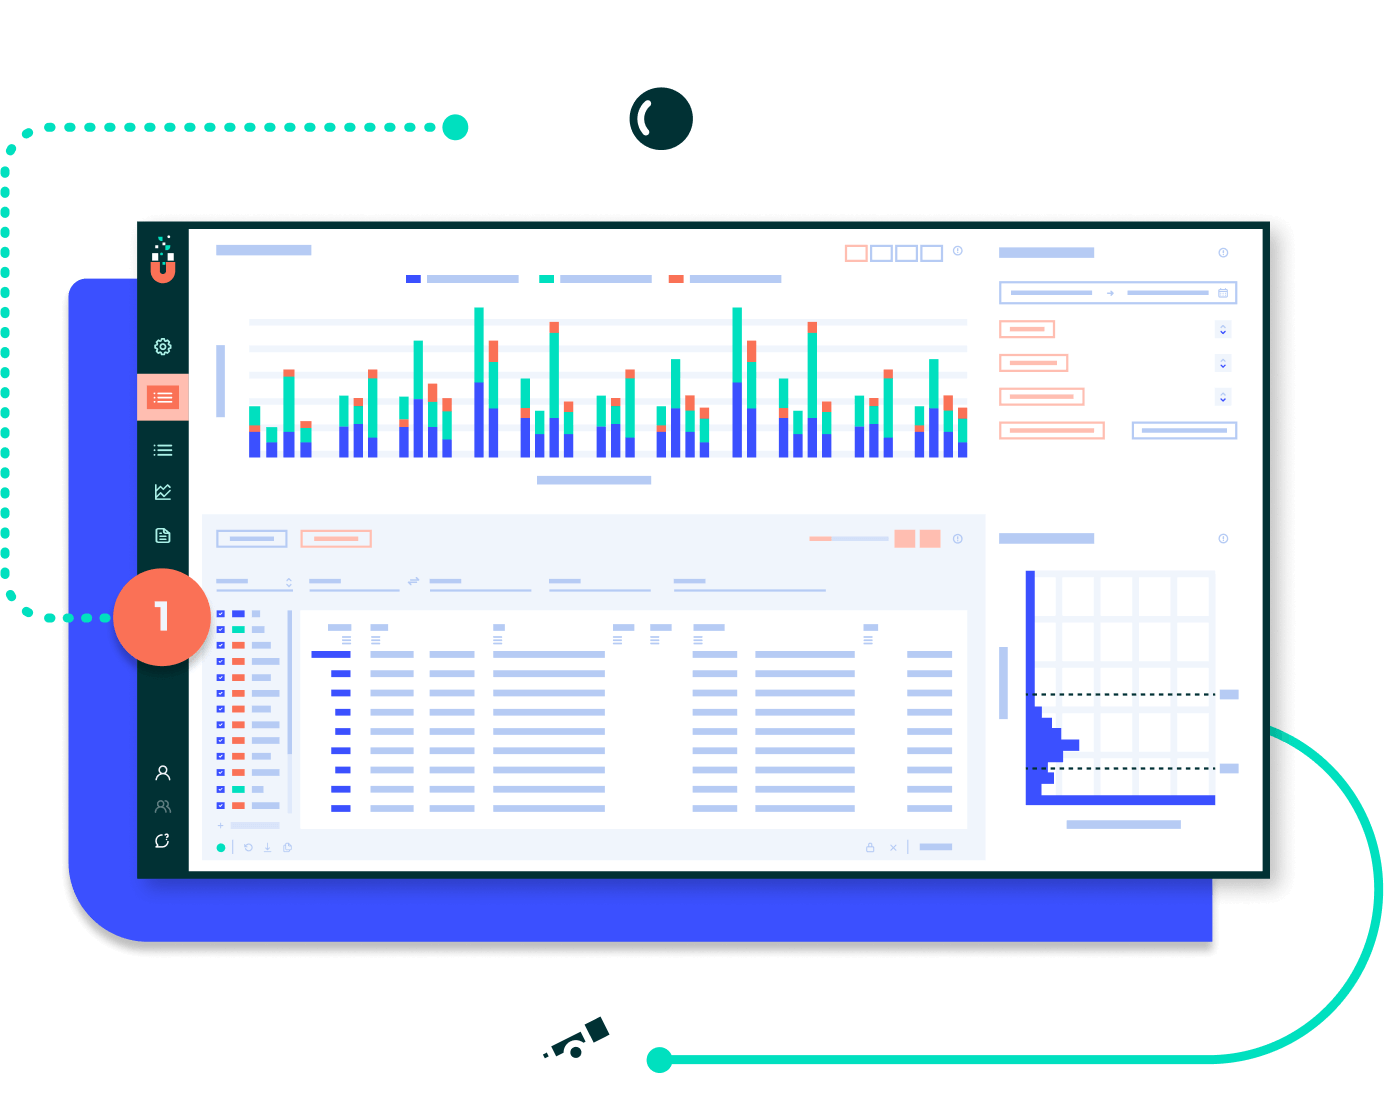
1 Single Pane of Glass

Observability as it’s meant to be, all in one place and fully connected. When your logs indicate problematic traces, the traces are right there where you’d want them to be and not off somewhere else.
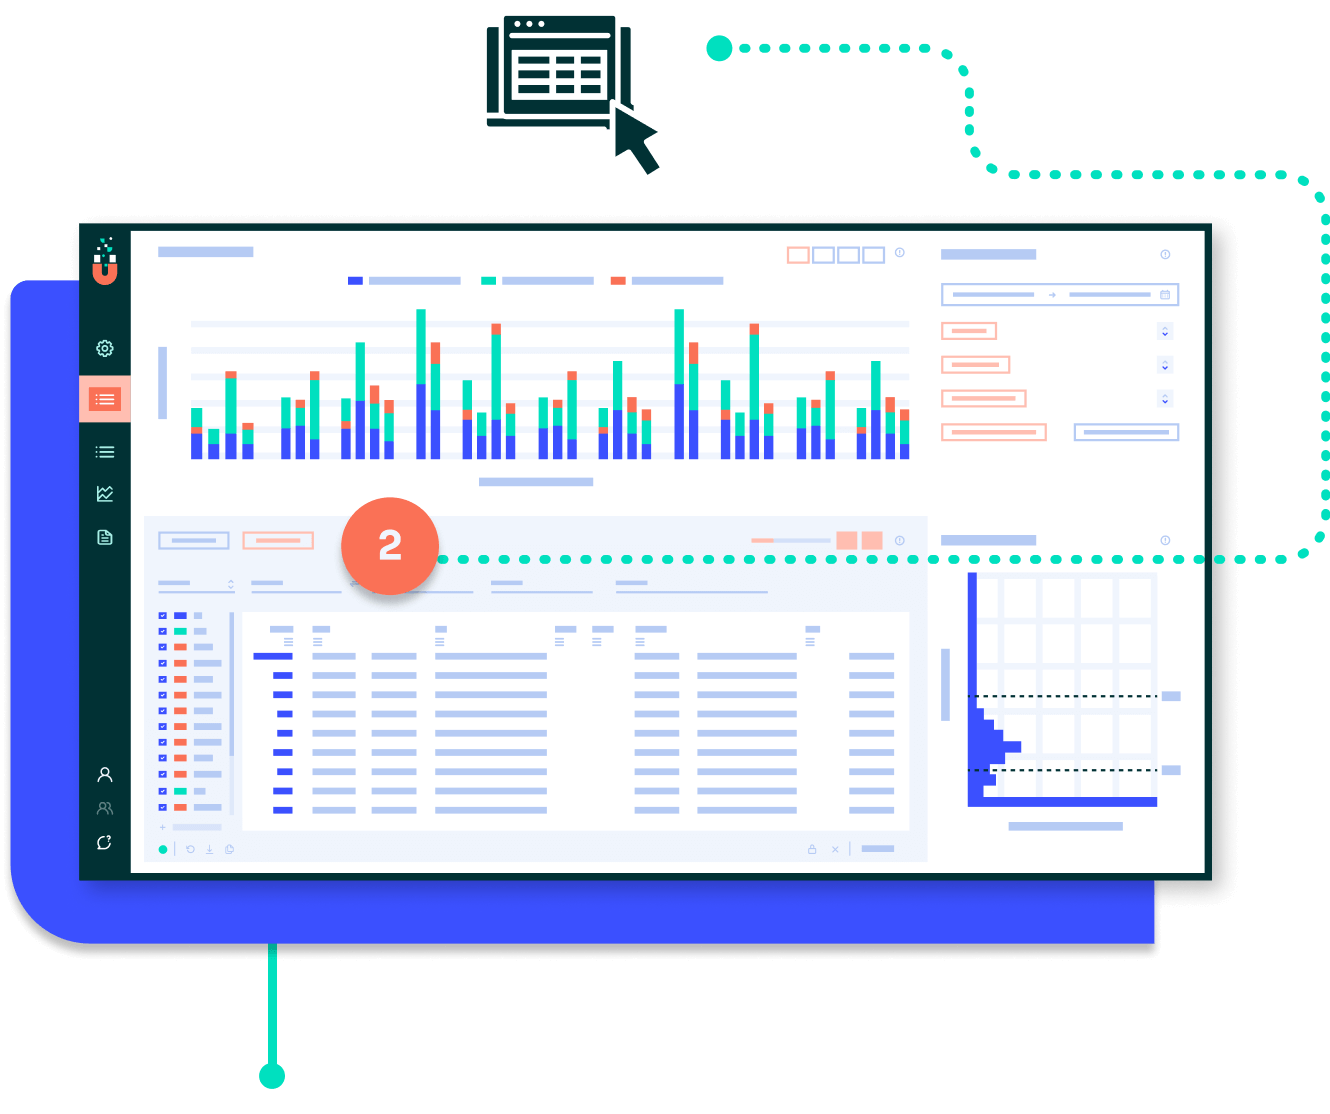
2 Spreadsheet-esque Display

View your telemetry data in a familiar tabular data format that is fast and effective for sifting through the haystack to find the needle.
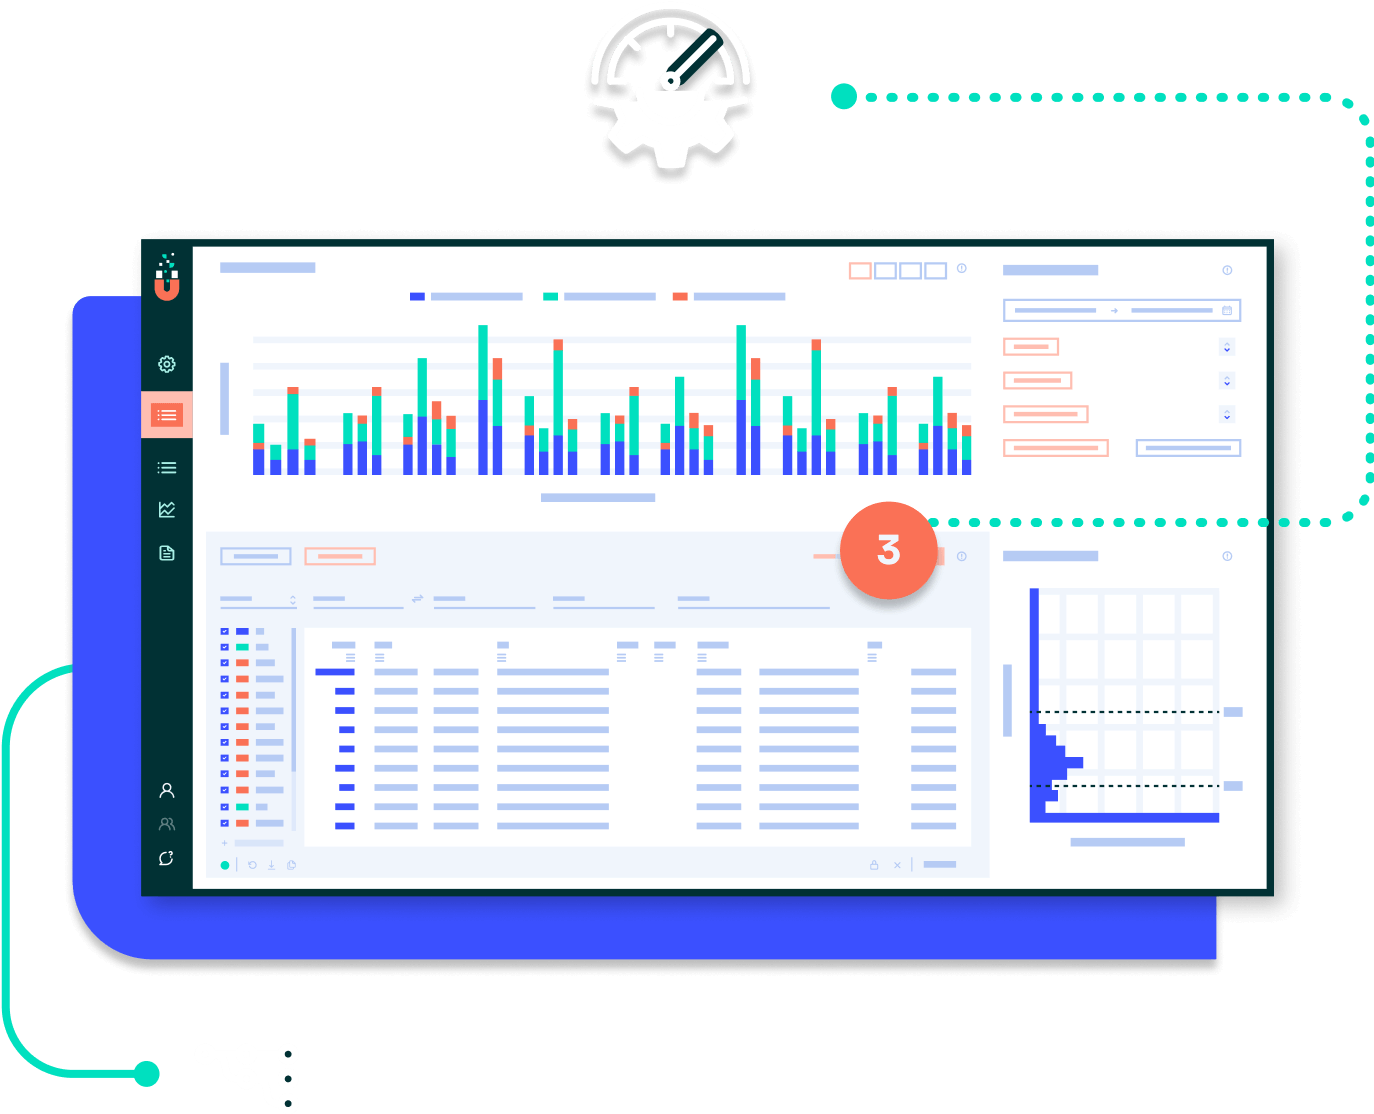
3 High-Performance, Wide Datasets

TelemetryHub streams your telemetry data into your browser in high-performance ldap formats, allowing you to explore lots of data efficiently without endless paging and click-throughs to find what you’re looking for. Any custom attributes included in your signals, whether from standard or custom instrumentation will be at your fingertips.
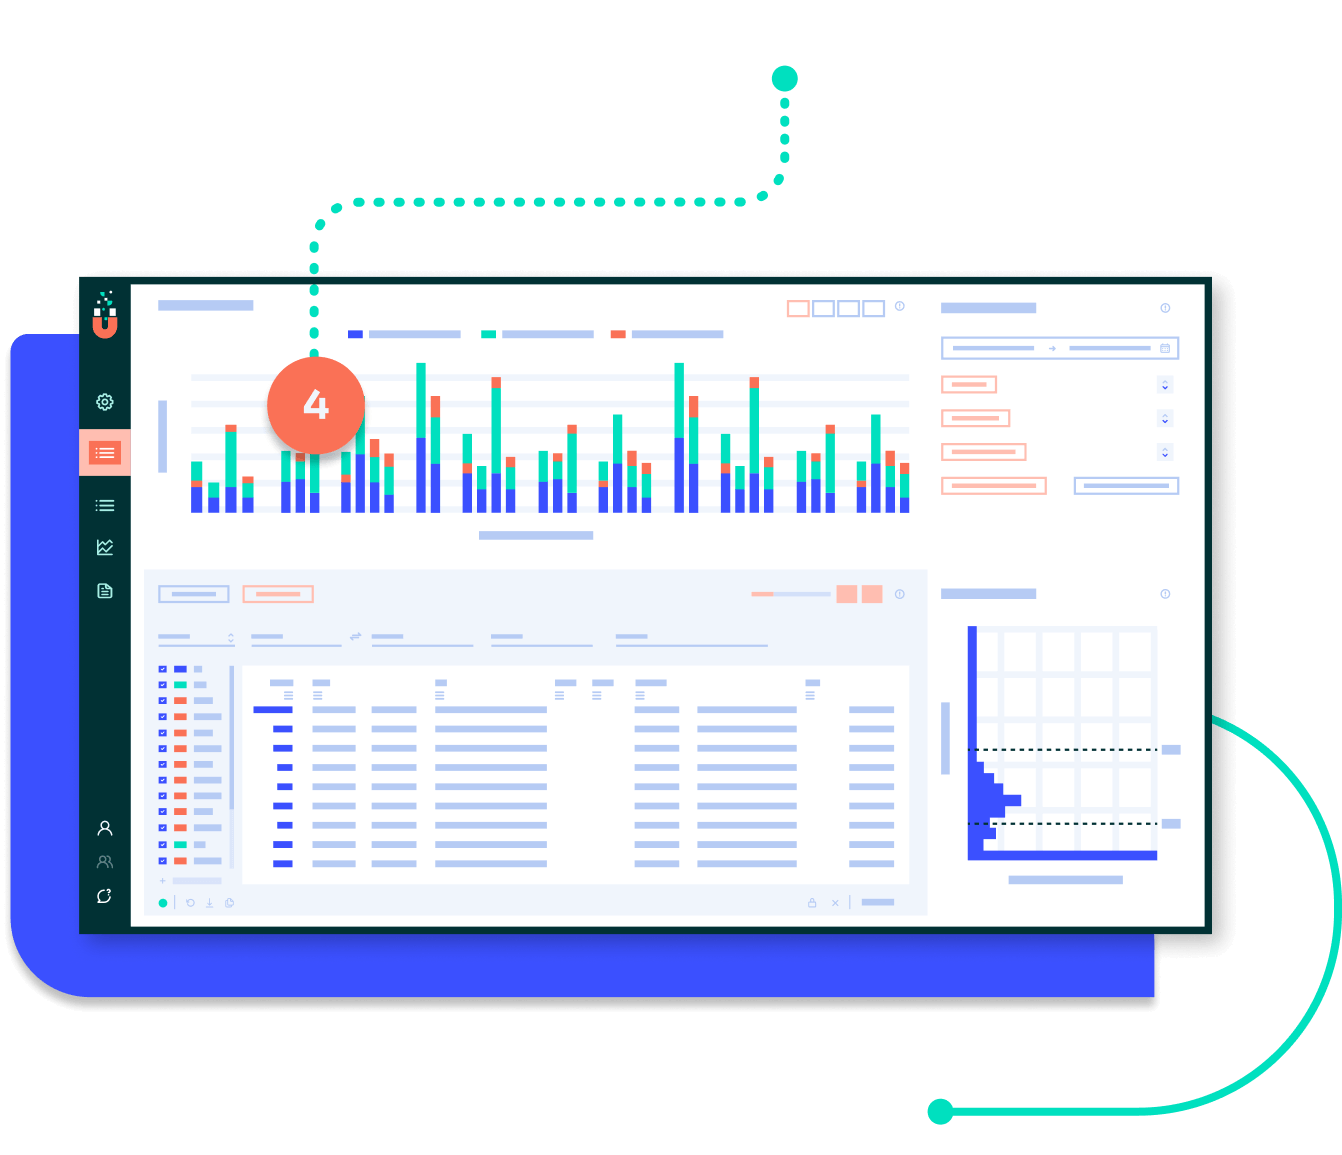
4 Responsive Visualizations

Charts and plots respond in real time as you filter through your telemetry data, reducing the time it takes to find the source of your issues.
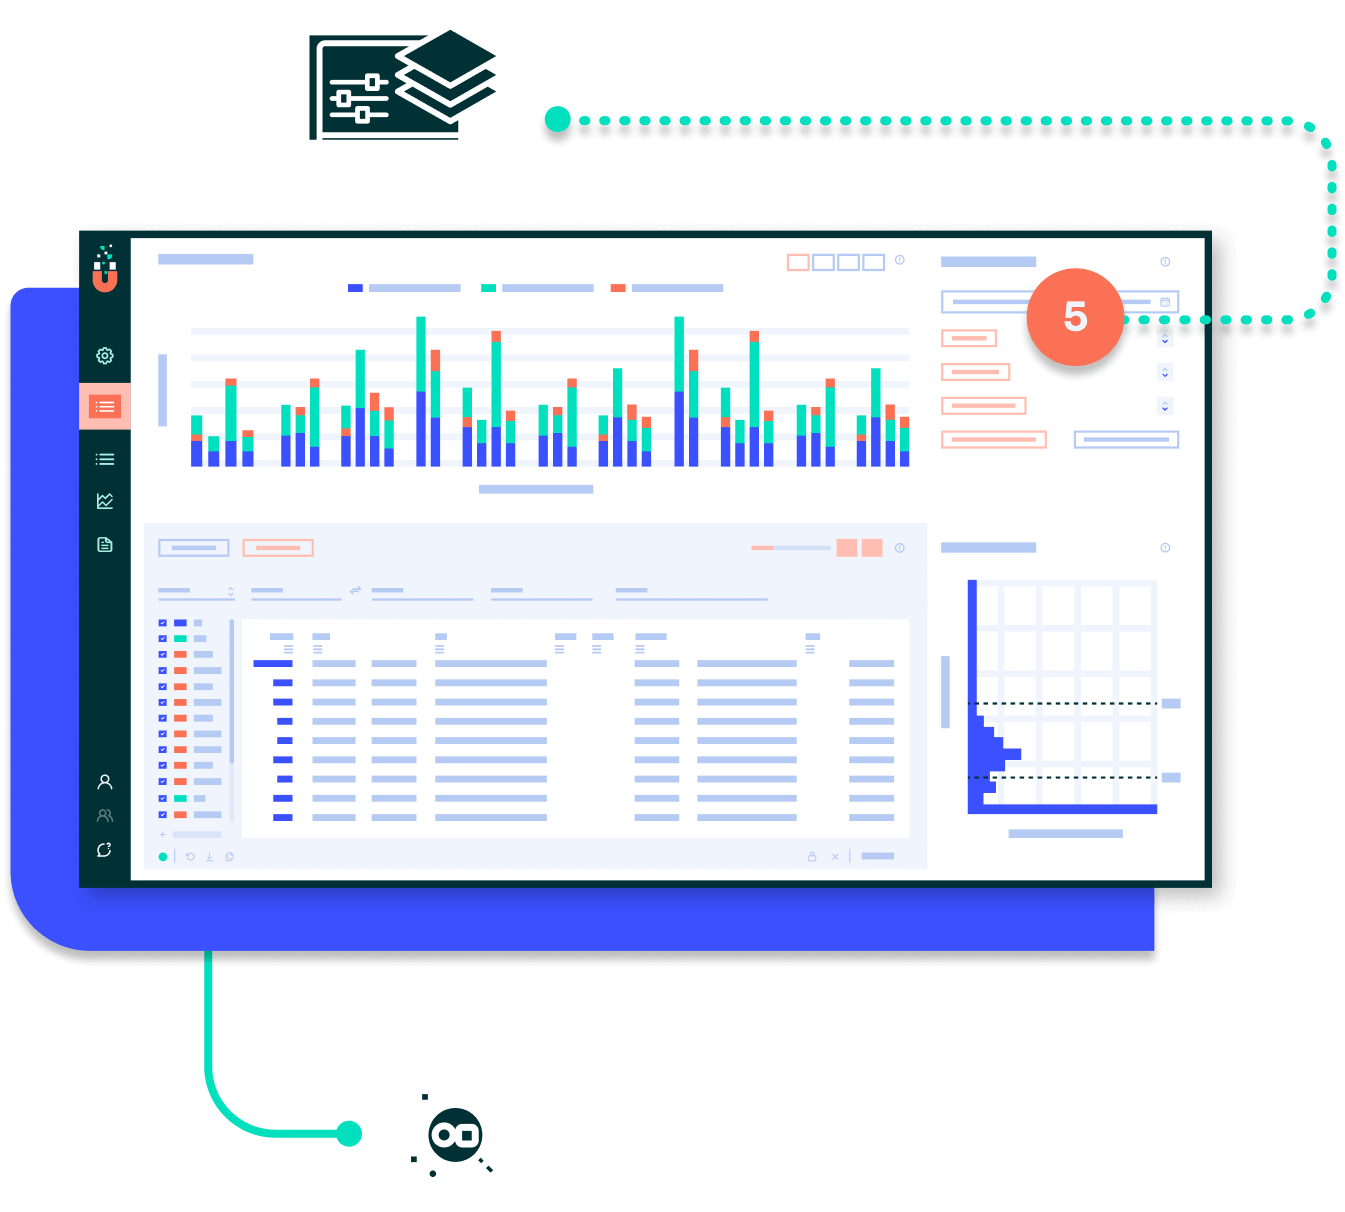
5 Multi-layered Filtering

Expressive pre-filtering allows you to put guard rails around the telemetry data you want streamed for viewing, while real-time local filtering gives you the ability to quickly find the interesting needles in your haystack.
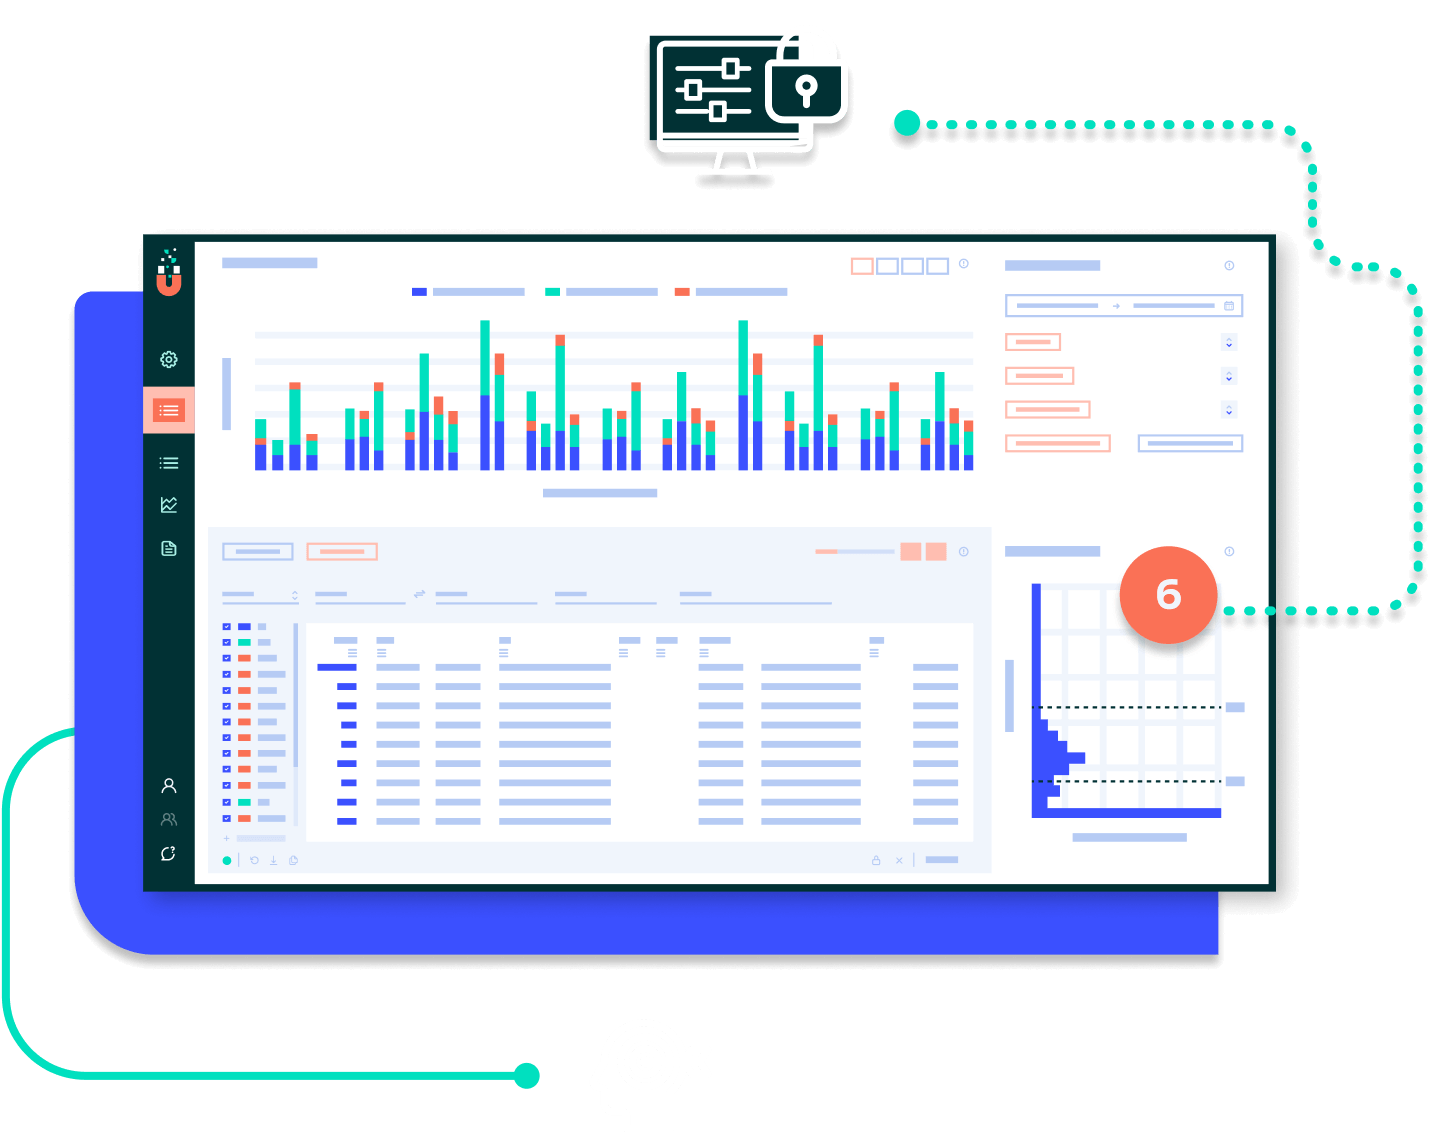
6 Sticky Context

Set once and go contextual filtering is preserved as you navigate through your telemetry data, which makes it much easier to navigate through your data without losing focus.
Single Pane of Glass graphic
Spreadsheet-esque Display graphic
High-Performance, Wide Datasets graphic
Responsive Visualizations graphic
Multi-layered Filtering graphic
Sticky Context graphic

TelemetryHub Product Roadmap

TelemetryHub Progress:

GA product ready

See how TelemetryHub is tracking alongside the OpenTelemetry timeline.

Get started with TelemetryHub

You can start reporting data today with a few simple configuration steps.