
Introduction to Apollo Link
Apollo Link is a toolkit that addresses common problems between your Apollo Client and your GraphQL server.
The Apollo team has explained that different teams have different requirements. Trying to create one GraphQL client library that meets everyone’s needs is impossible. Apollo Link helps solve this problem.
Apollo Link allows the community to create middleware hooks. You can use these hooks to create a custom version of Apollo Client to meet your GraphQL Client needs.
Apollo Link with OpenTelemetry Spans
A system must be well instrumented to be observable. In this guide, we will use OpenTelemetry to capture custom trace data from GraphQL. We can do this with a small piece of manual instrumentation using Apollo Link.

We can a link to wrap middleware around the GraphQL call. This link is a function that receives the context object of the request. These functions contain information about the GraphQL operation. The return statement of our link will have access to our response data.
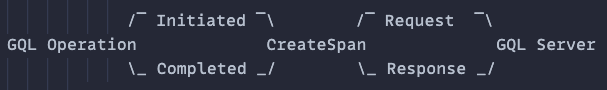
In OpenTelemetry, we capture a unit of work as a discrete Span. So, the first link in our chain should create a new Span. We will call it createSpanLink.
import { trace, SpanKind } from "@opentelemetry/api";

const createSpanLink = new ApolloLink((operation, forward) => {
  const tracer = trace.getTracer("@apollo/client");
  const span = tracer.startSpan(`gql.${operation.operationName}`, {
    startTime: operation.getContext().start,
    attributes: {
      user.id: myUser.id,
      // ... other attributes
    },
    kind: SpanKind.INTERNAL, // 0: Internal, 1: Server, 2: Client, 3: Producer, 4: Consumer
  });
  operation.setContext({ span });

  return forward(operation).map((data) => {
    span.end();
    return data;
  });
});
In the example, we create a new ApolloLink() and inside we set a tracer and a span. We start by creating some attributes to give our span useful information. We use operation.setContext({ span }) to make sure that we pass the same span to each link. The return statement of each links gets called once the GraphQL server has sent a response. We should call span.end() to verify the completed round trip.
Our chain now looks something like this:
Special Functions For Recording Exceptions
There will be instances where there is a GQLError or NetworkError during the trip. Luckily, Apollo Link already has a built-in solution for exception handling called onError(). A simple setup may look something like this:
// Create Error Link
import { onError } from "@apollo/client/link/error";

export const errorLink = onError(
  ({ graphQLErrors, networkErrors, operation }) => {
    if (graphQLErrors) console.log(graphQLErrors);
    if (networkErrors) console.log(networkErrors);
  }
);
This uses the built-in onError() function to send errors to the console. But, we want to add the context of these errors to our span.
OpenTelemetry spans have a special function for recording exceptions by using span.recordException(). This function accepts either: an object with up to 4 optional keys (code, message, name, and stack) or a string. We can set the status code with span.setStatus() which takes SpanStatusCode as a parameter. Here is an example:
// Create Error Link
import { onError } from "@apollo/client/link/error";
import { SpanStatusCode } from "@opentelemetry/api";
export const errorLink = onError(
({ graphQLErrors, networkError, operation }) => {
const span = operation.getContext().span;
span.setStatus({ code: SpanStatusCode.ERROR });
if (graphQLErrors) {
graphQLErrors.forEach(({ message, locations, path }) => {
span.recordException({
message: `[GraphQL error]: Message: ${message}, Location: ${locations}, Path: ${path}`,
});
});
span.end();
}
if (networkError) {
span.recordException({
message: `[Network error]: ${networkError}`,
});
span.end();
}
}
);
The Apollo Link documentation says that the onError() link should be the first link of your chain. But we want our CreateSpanLink to observe our entire chain. Because of this, it makes sense to add the onError link as the second link. Our completed chain should look something like this:

Envisioning Apollo Link Traces Inside TelemetryHub
We can now visualize our GraphQL calls in TelemetryHub. Navigate to the Traces tab. We can filter on all of the traces to show the new Apollo Link traces in the table on the bottom left of the UI. Use the Where filtering function and set it to where libraryName == @apollo/client. Note: the library name was set by us when we initialized our tracer in createSpanLink.

From there, we are able to investigate each individual trace. By clicking on one of these traces, TelemetryHub will navigate you to the Trace Details page. Here’s an example of a GraphQL query trace:

Introducing Links to Apollo Client
The final step is to modify ApolloClient. This will add links to your GraphQL calls. We can use the link key from ApolloClient’s optional options argument. We can pass link a function called from() which takes an array of our newly created Links. It expects our Links array to be in the order we want for our final chain. Here is an example:
const apolloClient = new ApolloClient({
  link: from([
    createSpanLink,
    errorLink,
  ]),
});
The End Result
import {
  ApolloClient,
  ApolloLink,
} from "@apollo/client/core";
import { trace, SpanKind, SpanStatusCode } from "@opentelemetry/api";
import { onError } from "@apollo/client/link/error";

// Create Span Link
export const createSpanLink = new ApolloLink((operation, forward) => {
  const tracer = trace.getTracer("@apollo/client");
  const span = tracer.startSpan(`gql.${operation.operationName}`, {
    startTime: operation.getContext().start,
    attributes: {
      user.id: myUser.id,
      // ... other attributes
    },
    kind: SpanKind.INTERNAL, // 0: Internal, 1: Server, 2: Client, 3: Producer, 4: Consumer
  });
  operation.setContext({ span });

  return forward(operation).map((data) => {
    span.end();
    return data;
  });
});

// Create Error Link
export const errorLink = onError(
  ({ graphQLErrors, networkError, operation }) => {
    const span = operation.getContext().span;
    span.setStatus({ code: SpanStatusCode.ERROR });
    if (graphQLErrors) {
      graphQLErrors.forEach(({ message, locations, path }) => {
        span.recordException({
          message: `[GraphQL error]: Message: ${message}, Location: ${locations}, Path: ${path}`,
        });
      });
      span.end();
    }

    if (networkError) {
      span.recordException({
        message: `[Network error]: ${networkError}`,
      });
      span.end();
    }
  }
);

const apolloClient = new ApolloClient({
  link: from([
    createSpanLink,
    errorLink,
  ]),
});

export default apolloClient;
You can view your telemetry data for free on TelemetryHub.

