Django, with its robust web framework capabilities, and Celery, excelling in handling asynchronous tasks, together create a formidable duo for building scalable and efficient applications. While the marriage of these two technologies offers immense benefits like improved user experience and enhanced performance, it’s not without its challenges.
As applications grow in complexity, developers often grapple with issues related to task failures, resource bottlenecks, or unpredictable latencies. Enter OpenTelemetry: a tool designed to shed light on these dark corners.
Here, we’re going to show how OpenTelemetry can be harnessed to monitor Django and Celery applications, ensuring that while we reap the benefits, we also keep potential problems in check.
How Telemetry Helps With Django And Celery
Celery is a distributed task queue system that allows developers to execute tasks asynchronously, outside the usual HTTP request/response flow. The main motivations behind using Celery with Django are:
- Improved Performance and User Experience: By moving time-consuming tasks out of the synchronous request/response cycle, users don’t have to wait for these tasks to finish. For instance, if a user action triggers an email, that email-sending process can be offloaded to Celery, and the user receives an immediate response from the web server.
- Scalability: Celery allows you to distribute tasks across multiple worker nodes or even different servers. This distribution makes it easier to scale your application horizontally by adding more workers as the load increases.
- Reliability: Celery provides mechanisms for retrying failed tasks, ensuring that transient failures don’t cause tasks to be lost. With proper backends like RabbitMQ or Redis, tasks are persisted until they’re successfully executed.
- Scheduled Tasks: Beyond just asynchronous task execution, Celery provides support for periodic tasks. This is useful for operations like daily reports, data cleaning, or any other task that needs to be run at regular intervals.
But as a tool that runs in the background and is being used because it is scalable and reliable, it pays to monitor Celery use to identify problems or anomalies such as:
- Task Latency: By analyzing traces, you can determine how long each task takes to execute. Any unexpected increases in task duration can be identified and investigated.
- Task Failures: OpenTelemetry can capture when a task fails and provide detailed information about the error, helping developers diagnose and fix the issue.
- Queue Delays: If tasks are waiting in the queue for a long time before being picked up by a worker, this can be observed as a delay in the start time of the task trace.
- Resource Bottlenecks: By observing the duration of different spans within a task, you can identify if there’s a particular resource (like a database or an external API) causing a bottleneck.
- Task Retries: If tasks are being retried frequently, this can be observed in the telemetry data, indicating potential issues with task execution.
- Worker Overload: If you’re capturing metrics, you might observe spikes in the number of tasks being processed or in the queue, indicating that workers might be overloaded.
- Memory or CPU Issues: While OpenTelemetry primarily focuses on traces and metrics, in conjunction with system monitoring tools, you can correlate high task latencies or failures with memory or CPU spikes.
- Broker Issues: If there are connectivity or performance issues with the message broker (e.g., RabbitMQ or Redis), this might manifest as delays in task dispatching or failures in task execution.
- Task Prioritization Issues: If high-priority tasks are being delayed due to a large number of low-priority tasks, this can be observed in the telemetry data.
- Concurrency Issues: If tasks are competing for shared resources or there are race conditions, these might manifest as task failures or unexpected behavior, which can be captured in traces.
So, there are a lot of reasons to use telemetry with Django and Celery. And luckily, it is very easy to set this up and start getting data immediately.
Setting Up Telemetry With Django and Celery
We’ll presume you have a Django app using Celery set up. If not, you can follow the tutorials here and here to set up Django and Celery, respectively.
Adding telemetry to Django and Celery is a matter of:
- Setting Up the OpenTelemetry SDK: This involves installing the necessary OpenTelemetry libraries and setting up the SDK to export traces to your desired backend (in this case, TelemetryHub, but it could be Jaeger, Zipkin, Prometheus, and so on).
- Instrumenting Django: OpenTelemetry provides auto-instrumentation packages for Django which will automatically trace HTTP requests, database queries, and other operations.
- Instrumenting Celery: Celery workers can be instrumented to trace task execution. This is useful for understanding the latency, errors, and other metrics for background tasks.
- Configuring Exporters: The traces and metrics generated need to be exported to an observability backend where you can visualize and analyze them.
Let’s start with setting up OpenTelemetry. OpenTelemetry is a set of APIs, libraries, agents, and instrumentation to provide observability for applications. To monitor Django and Celery applications with OpenTelemetry, we need to install both the general OpenTelemetry libraries and the specific OpenTelemetry libraries for Django, Celery, and the OTLP exporter:
Install the general OpenTelemetry packages and the exporter:
pip install opentelemetry-api opentelemetry-sdk opentelemetry-exporter-otlp
- opentelemetry-api: This library provides the core set of abstract classes and interfaces for OpenTelemetry, which define the tracing and metrics APIs that applications and libraries can use to produce telemetry data.
- opentelemetry-sdk: This is the default implementation of the OpenTelemetry API, providing the necessary components to collect, process, and export telemetry data.
- opentelemetry-exporter-otlp: This library provides an exporter to send telemetry data in the OpenTelemetry Protocol (OTLP) format, allowing integration with backends that support OTLP, such as TelemetryHub.
Then install the Django instrumentation package:
pip install opentelemetry-instrumentation-django
And then install the Celery instrumentation package:
pip install opentelemetry-instrumentation-celery
With all of the libraries installed, we can start using them in our code. We’re going to instrument our app in two ways:
- Auto-instrumentation: This method leverages OpenTelemetry’s built-in capabilities to automatically instrument certain libraries and frameworks without requiring manual code changes. By simply running your application with specific commands or configurations, OpenTelemetry can capture telemetry data from supported integrations like Django, Flask, and database drivers.
- Manual instrumentation: This approach involves explicitly adding OpenTelemetry API calls within your application code to capture custom spans, attributes, or events. Manual instrumentation provides finer control over what gets instrumented, allowing for detailed tracking of specific operations or workflows that may not be covered by auto-instrumentation.
We’ll use auto-instrumentation to capture events in the entire Django app, and then manually instrument our Celery worker for more fine-grained control over what is sent to our observability backend.
Django auto-instrumentation
First, Django. It is very easy. All we need to do is make a small change to our manage.py script. Import the DjangoInstrumentor:
from opentelemetry.instrumentation.django import DjangoInstrumentor
Then call it within main():
def main():
"""Run administrative tasks."""
os.environ.setdefault("DJANGO_SETTINGS_MODULE", "django_celery.settings")
# This call is what makes the Django application be instrumented
DjangoInstrumentor().instrument()
try:
from django.core.management import execute_from_command_line
except ImportError as exc:
raise ImportError(
"Couldn't import Django. Are you sure it's installed and "
"available on your PYTHONPATH environment variable? Did you "
"forget to activate a virtual environment?"
) from exc
execute_from_command_line(sys.argv)
if __name__ == "__main__":
main()
This means our collector will be initialized immediately on server start and will collect all events from then on.
That’s it. Told you it was easy.
Celery manual instrumentation
The manual instrumentation approach is a little more involved, but not much. Here we can have a Celery task that sends an email send_feedback_email_task(email_address, message). We want to instrument this particular function and send some specific information to our backend. All the below goes in your tasks.py file with your Celery tasks.
First, we need to import a lot of functions from OpenTelemetry:
from opentelemetry import trace
from opentelemetry.exporter.otlp.proto.grpc.trace_exporter import OTLPSpanExporter
from opentelemetry.sdk import resources
from opentelemetry.sdk.trace import TracerProvider
from opentelemetry.sdk.trace import export as trace_export
from opentelemetry.instrumentation.celery import CeleryInstrumentor
Let’s break down each of these imports:
- from opentelemetry import trace: This imports the main tracing API from OpenTelemetry. It provides foundational constructs such as the tracer which is used to create and manage spans.
- from opentelemetry.exporter.otlp.proto.grpc.trace_exporter import OTLPSpanExporter: This imports the OTLPSpanExporter, which is responsible for sending the captured span data to an observability backend that supports the OpenTelemetry Protocol (OTLP) over gRPC.
- from opentelemetry.sdk import resources: This provides access to the Resource construct in OpenTelemetry. A Resource is an immutable representation of the entity producing telemetry, like a service, host, or any other source. It can be used to attach metadata about the entity, such as service name, version, etc.
- from opentelemetry.sdk.trace import TracerProvider: This imports the TracerProvider from the SDK, which is an implementation of the tracing provider. It’s responsible for creating Tracer instances.
- from opentelemetry.sdk.trace import export as trace_export: This provides access to constructs related to exporting trace data in the SDK. For instance, it can be used to set up different span processors, which determine how and when spans are exported to the backend.
Together, these imports provide the necessary tools and constructs to set up OpenTelemetry for capturing, processing, and exporting telemetry data. Next, we’ll call them in our code. The first thing to do is set up our resources, span exporters, and tracing.
Let’s start with resource creation:
resource = resources.Resource(
attributes={
resources.SERVICE_NAME: "MY_SERVICE_NAME",
resources.SERVICE_NAMESPACE: "MY_SERVICE_NAMESPACE",
}
)
Here, a Resource object is being created. The attributes dictionary assigns two attributes to the resource: SERVICE_NAME and SERVICE_NAMESPACE, both of which are defined in the OpenTelemetry specification to describe the service.
Then we initialize the span exporter:
span_exporter = OTLPSpanExporter(
headers={"x-telemetryhub-key": "INGEST-KEY"},
endpoint="https://otlp.telemetryhub.com:4317"
)
The OTLPSpanExporter is responsible for exporting span data to the observability backend using the OpenTelemetry Protocol (OTLP). The headers argument is used to send custom headers during the export, in this case, the API key for TelemetryHub. The endpoint specifies where the exported data should be sent.
Then we initialize the span processor:
trace_processor = trace_export.BatchSpanProcessor(span_exporter)
This processor batches multiple spans and exports them in one go, reducing the number of outbound calls and often improving performance. The span_exporter created earlier is passed to this processor, indicating where the batched spans should be sent.
Then we initialize the tracer provider:
trace_provider = TracerProvider(resource=resource)
trace.set_tracer_provider(trace_provider)
trace_provider.add_span_processor(trace_processor)
A TracerProvider is created and associated with the previously defined Resource. The global tracer provider is then set to this trace_provider which means any subsequent calls to get a tracer will use this provider. The previously created trace_processor is added to the tracer provider, ensuring that any spans generated will be processed (and eventually exported) by that processor.
Finally, we initialize the tracer:
tracer = trace.get_tracer(__name__)
This object is responsible for creating and starting new spans.
Then we can finally instrument our Celery task. This is what the uninstrumented task looks like:
@shared_task()
def send_feedback_email_task(email_address, message):
"""Sends an email when the feedback form has been submitted."""
sleep(20) # Simulate expensive operation that freezes Django
send_mail(
"Your Feedback",
f"\t{message}\n\nThank you!",
[email_address],
fail_silently=False,
)
And with instrumentation:
@shared_task()
def send_feedback_email_task(email_address, message):
with tracer.start_as_current_span("process_result"):
span = trace.get_current_span()
span.set_attribute("email", email_address)
span.set_attribute("message", message)
"""Sends an email when the feedback form has been submitted."""
sleep(20) # Simulate expensive operation that freezes Django
send_mail(
"Your Feedback",
f"\t{message}\n\nThank you!",
[email_address],
fail_silently=False,
)
The added code starts a new span named “process_result”, retrieves that span, and then adds two attributes to it: one for an email address and one for a message. The span captures the duration of the operations enclosed in the `with` block and provides context about those operations through the added attributes.
All done. If we use the app (adding a message to the form), we’ll see our traces and spans in TelemetryHub:
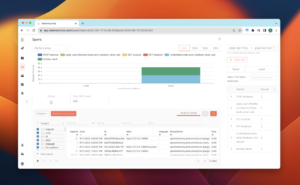
We can see spans from both the Django component (The POST and GET calls from the form) and the manually instrumented Celery task.
Note: you can also auto-instrument Celery using CeleryInstrumentor in the same way you instrument Django–just add:
from opentelemetry.instrumentation.celery import CeleryInstrumentor
And:
CeleryInstrumentor().instrument()
To your tasks.py instead of the manual instrumentation.
The next steps here are going to be instrumenting more functions, as well as adding more data to be sent through about each function to our TelemetryHub. On the TelemetryHub side, we can start to observe the data to get an understanding of any current bottlenecks in performance and look for any errors or issues that arise.
Given the ease with which instrumentation happens when using OpenTelemetry and a backend such as TelemetryHub, you should always want to add this functionality to your Django and Celery apps. Because when your tasks start piling up or running slow, you’ll want to see this data.

