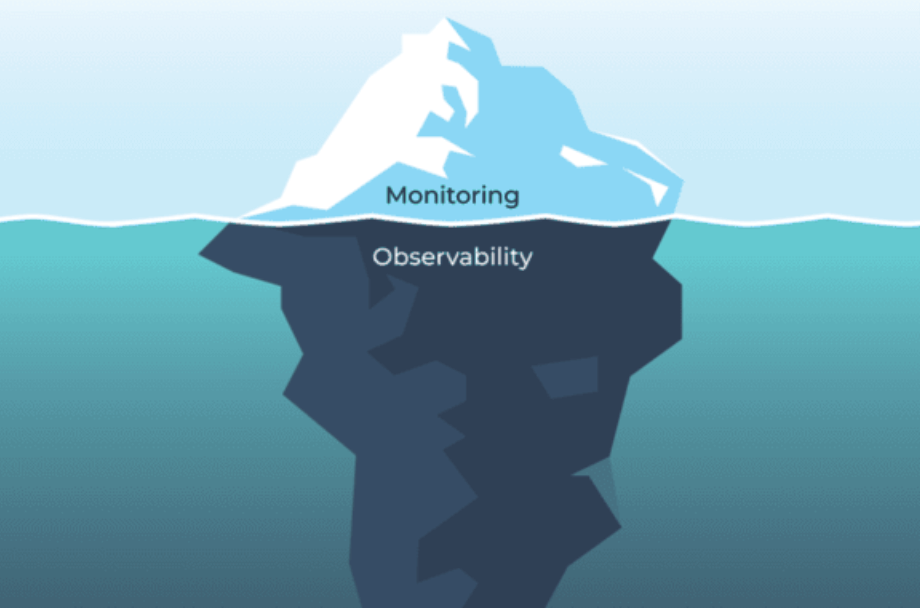
Given the current industry frenzy surrounding full-stack observability, Scout finds it surprising that “observability vs. monitoring” ranks as the most popular search related to the topic. It is obvious that the two concepts and each one’s fundamental definition are not well understood.
Let’s start with the basics – they are NOT the same concept! Although several vendors have attempted to appropriate the term “observability” to advertise their monitoring solutions, the concepts are inherently different and require a thoughtful understanding of how they are different and what they can provide for your systems.
Let’s first explore the basic principles that are different between them rather than jumping immediately into the technical differences between them. Then in part two of this blog post, we’ll use technical examples to reinforce the concepts.
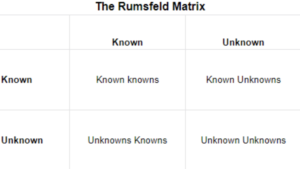
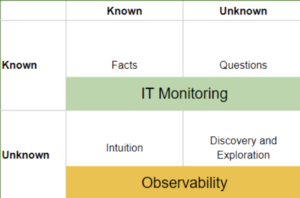
The easiest way to understand the difference between observability and monitoring is to look at what is commonly referred to as the Rumsfeld Matrix.
This matrix has been used and applied across several different professions; it is most commonly employed for risk management and famously renowned for personal development when applied to self-knowledge. However, it gained its biggest notoriety when US Secretary of Defense Donald Rumsfeld used it in a press briefing. If you haven’t seen it – check out this brief clip for a good laugh!
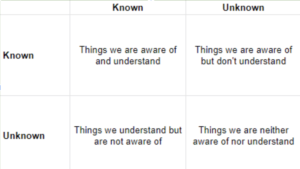
When you apply this a bit further, you can see that it is a useful tool for considering what we actually know. One good explanation of this can be seen by Andrea Mantovani in a recent posting he did on Medium, which he explains it in this way:
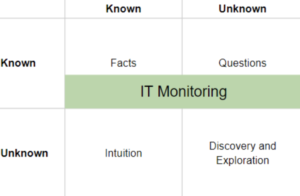
So how does all this apply to the question of monitoring vs. observability? Well, all monitoring tools are set up to monitor something already defined. We monitor all sorts of things that commonly include availability monitoring, web performance monitoring, application performance management, API management, real user monitoring, and security monitoring. All of these are known IT issues with defined states and metrics to measure and monitor the condition and status of our IT systems.
Given our systems architectures’ ever-growing complexity, there are dozens of possible metrics you can measure and set alerts and warnings to help you effectively monitor your IT systems. In the last few years, there has been an explosion of machine learning-enabled tools to help you manage to monitor, and many of them help you create dynamic instead of static alerting levels by analyzing past performance patterns. While they all claim to be AIOps or MLOps-focused tools, they are still just managing what we know as the universe of potential problems. A while back, Stephen Bigelow wrote a nice overview piece on TechTarget that outlined all the various elements of monitoring, and at Scout, our first main product was an excellent Application Performance Monitoring (APM) tool that is still relevant today to customers who need to avoid downtime of critical applications.
This example, which includes the placement of conventional IT monitoring within the matrix, is another typical way to represent the matrix:
Conversely, observability is designed to give you the tools and capabilities to discover what you don’t know. It allows you to explore the intricacies of your systems by combining logs, metrics, and trace data from all elements of your complex stack environment to try and discover what is happening.
If you use this matrix to compare observability and monitoring, you can see that observability gives you the framework and tools you need to deal with the unknown.
Because observability is in its early days of market acceptance, it is important to think about what the implications might be for being able to explore the unknowns. In some ways, it is the opposite of traditional monitoring approaches as you aren’t setting pre-defined elements to measure and alert against. Instead, you are constantly looking at the volumes of data to find outliers and other unique system state combinations that may be causing issues. You might also be using observability to observe a system before making a change and then observing post-change again to document any resulting changes in systems behavior.
With the recent advances of OpenTelemetry as the emerging standard for Observability, you can now leverage powerful new exploratory tools like TelemetryHub to dive into your data – and explore deep traces and spans that bring you the insight you need to begin understanding and troubleshooting your most complex system problems.

