How to choose between Scout APM and TelemetryHub
There was a time when APM was all anyone needed. Older monolithic web services were monitored with application performance monitoring (APM) tools. These tools provide detailed insights into how the web service is performing and can alert administrators to potential issues before they become widespread. So APM brought us out of the era of having your users be the first people who noticed a serious problem. Instead, our monitoring tools could tell us trouble was brewing beforehand.
APM tools give insights into key performance indicators such as response time, request volume, error rates, resource utilization, and more. This data can be used to identify problems in code execution, detect memory leaks, or any other issue that may be affecting the web service’s performance.
And many teams are still using traditional application monitoring and are very satisfied with the results!
But here are some questions to ask about tools like Scout APM:
Are we committed to open standards for APM?
By using open standards, operations engineers can save time and resources by avoiding the need to develop complex proprietary workarounds or bespoke protocols for their systems. Furthermore, open standards provide a well-defined framework within which engineering teams can collaborate on developing better operational processes and systems across multiple organizations or departments within one organization. Standard APM tools transmit data in their own protocols, and the more you have to learn about them the more you’re gaining specialized vendor experience rather than open standards. This leads us to the second concern:
Are we locked into one vendor?
The recent incident involving DataDog’s attempt to quash an OpenTelemetry commit brought up a significant concern about APM vendors. When these vendors claim to ‘embrace’ open standards, are they really saying ‘we’ll consume whatever data you want to send us, you just can’t take your data anywhere else.’
These policies remind us a bit of the bad old days of SaaS where removing your data from a CRM or office tool was nearly impossible. How have APM companies gotten away with this for so long? Probably because portability in this case isn’t really about portability of historical data. Think about it: when migrating monitoring to another service it probably doesn’t matter if you bring with you performance data from 2017.
So lock in, in this case, isn’t so much about your data being held hostage, and more about the sometimes extreme difficulty of moving to different services.
If you’re using an APM tool you really have to agree that you’re going to stick with a single tool for a very long time, maybe for years
How monolithic is our architecture?
While an APM solution works well in a monolithic environment, and fine if you have 12 or so different services running, once you go much beyond that you’re going to struggle. See ‘Your Architecture defines your destiny’ later in this piece
How much flexibility and customization do you need for application performance management?
One of the original selling points of APM was a great ‘out of the box’ experience. When installing Scout APM on a Rails application, you get a great map of your tool within a few hours. But with any APM tool that ‘out of the box’ experience can start to feel like you’re ‘boxed in.’
After all, monitoring can do a lot more than finding performance problems. Maybe you’d like to do some security scanning, compliance checks, or gather business intelligence metrics. With a closed source APM tool you’ll largely be limited to the uses that the creators of the tool predicted.
With Open Telemetry, most especially with the use of the OpenTelemetry Collector, you can send, format, and view data from your services, no matter what your use case.
Your Architecture defines your APM destiny
Selecting TelemetryHub (and the underlying OpenTelemetry project that TelemetryHub is built for) is a lot easier if you have a large number of microservices. How many is a large number? By the time you have dozens of microservices, on a multiple of the number of developers on your team, it’s time to think about OpenTelemetry.
OpenTelemetry allows us to instrument, monitor, and debug large numbers of microservices in an efficient manner. This is especially important in a distributed system with a large number of services that are communicating with each other. With OpenTelemetry, we can quickly diagnose issues across the services and detect performance bottlenecks. And with TelemetryHub, you can easily view and share the distributed traces that will show you how requests are traveling across your application.
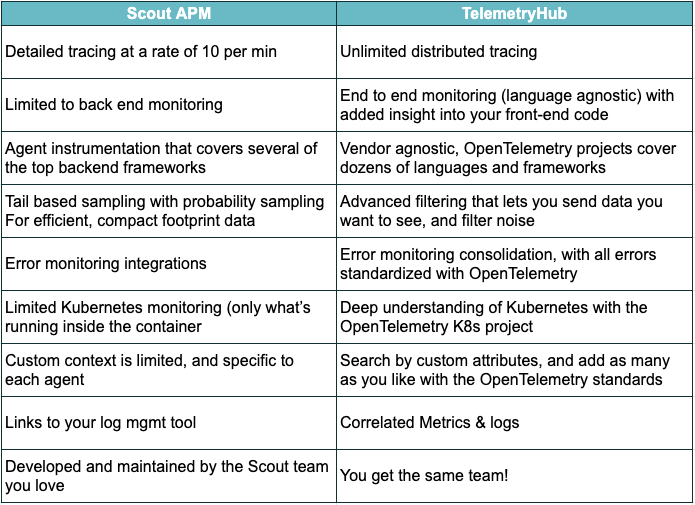
Here’s a table of key differences between Scout APM and TelemetryHub